In many ways, Covid has spurred discussion about how we want to live in the future. Lockdown measures have shown how positively less congestion and noise affect quality of life, and how the cityscape changes with more public space for pedestrians, bicycles and café terraces. The reallocation of street space is a major subject for debate.
Today, most of our cities still have a car-centric focus. We are so used to traffic jams and parked-up streets that we no longer even notice how much road space cars actually take up in our cities.
How quickly can 200 people get through a green light?
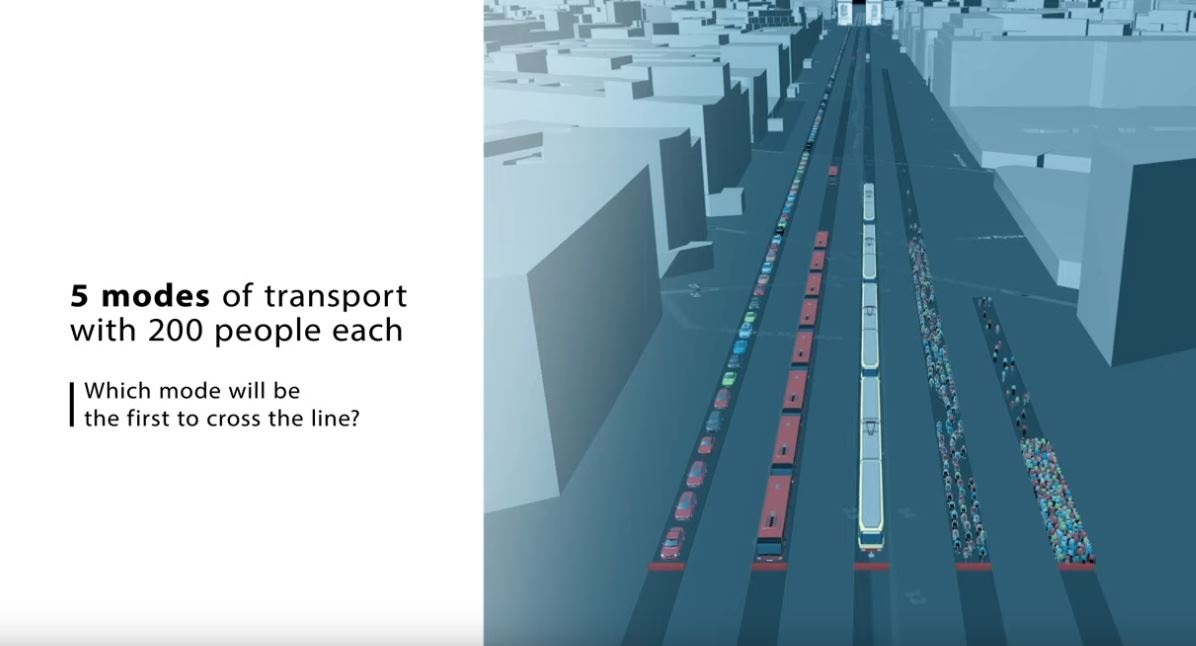
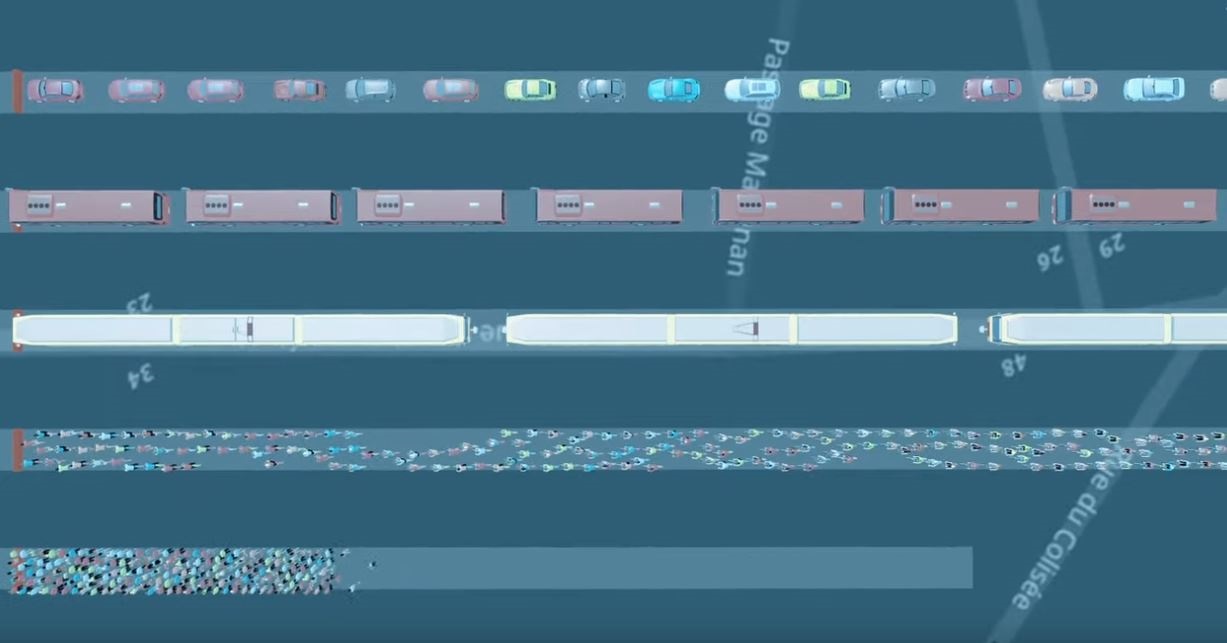
An animation by PTV Group shows how long it takes to shift 200 people past a traffic light, using various modes of transportation:
• An average of 1.5 people in 133 private cars
• 20 passengers in 10 buses
• 40 passengers in 5 trams
• 200 cyclists
• 200 pedestrians
So how much space do cars take up in our cities?
Unsurprisingly, cars prove to be the most ineffective in this regard.
In the animation cars line up for more than 1km in front of the traffic light compared to the tram (197m), the buses (134m) and the bicycles (115m). The pedestrians gather on a distance of about 28m.
And how fast did they cross the traffic light once it turned green? Buses and trams take just around 30 seconds, followed by pedestrians (about 40 seconds). For cyclists, it takes a little longer to get everyone started, almost 2 minutes.
And the cars? It takes more than 4 minutes to break up the long queue.
